
Qatar · 2025 data
Qatar's stranded gas
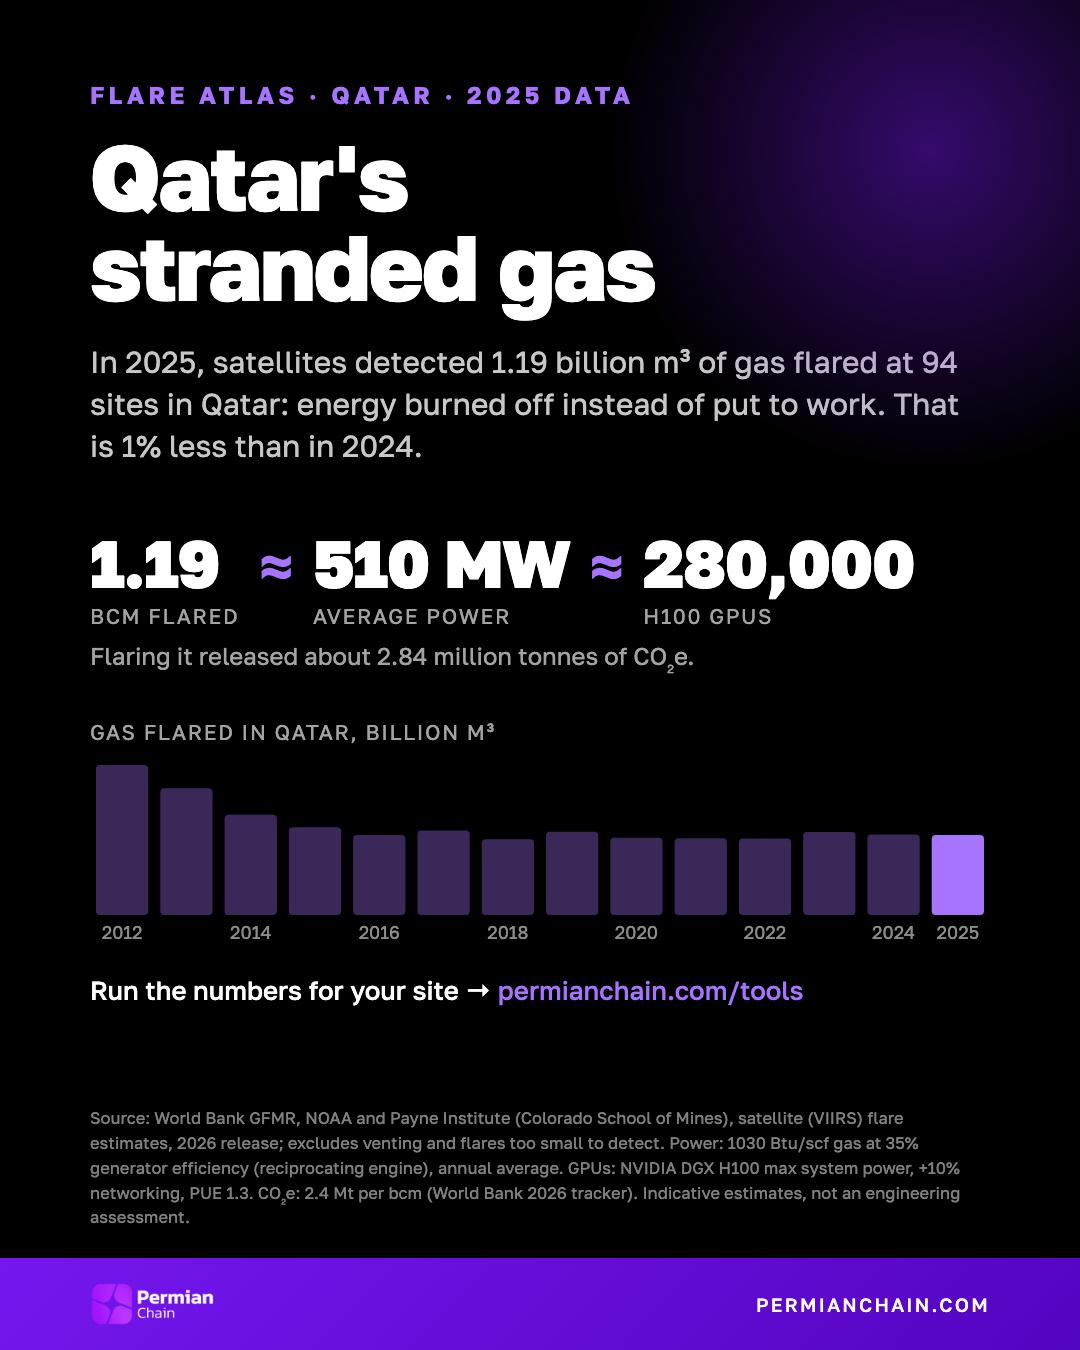
In 2025, satellites detected 1.19 billion m³ of gas flared at 94 sites in Qatar: energy burned off instead of put to work. That is 1% less than in 2024.
- 1.19
- billion m³ flared
- ≈510 MW
- average power
- ≈280,000
- H100 GPUs
- 2.84
- million t CO₂e
Gas flared in Qatar, billion m³
Data table
| Year | bcm flared | Flare sites |
|---|---|---|
| 2012 | 2.228 | 74 |
| 2013 | 1.881 | 69 |
| 2014 | 1.489 | 67 |
| 2015 | 1.302 | 67 |
| 2016 | 1.186 | 69 |
| 2017 | 1.254 | 72 |
| 2018 | 1.126 | 73 |
| 2019 | 1.236 | 77 |
| 2020 | 1.147 | 80 |
| 2021 | 1.139 | 80 |
| 2022 | 1.137 | 95 |
| 2023 | 1.231 | 89 |
| 2024 | 1.196 | 92 |
| 2025 | 1.187 | 94 |
Share this card
 Download card (JPG)
Have flared or stranded gas?
We assess energy assets for on-site power and modular compute.
Method and sources
- Flared volumes: World Bank Global Flaring and Methane Reduction Partnership (GFMR), NOAA and the Payne Institute at the Colorado School of Mines, flare volume estimates by individual flare location (2012–2025, 2026 release). They are satellite (VIIRS) estimates: venting and flares too small to detect are not included.
- Regions: countries as the World Bank assigns them. Alberta, the Permian Basin and the Bakken are latitude/longitude boxes around each area, so they are approximate.
- Power: gas at 1030 Btu/scf burned in reciprocating engines at 35% efficiency, averaged over the year. This is the same method as our gas-to-power calculator, where you can change every assumption.
- GPUs: NVIDIA DGX H100 maximum system power, plus 10% for networking and storage, at a PUE of 1.3.
- Emissions: 2.4 million tonnes CO₂e per bcm flared, from the World Bank's 2026 Global Gas Flaring Tracker (about 400 Mt from 167 bcm in 2025).
- These are indicative estimates, not an engineering assessment of any site.